Quantcast
Channel: Management – All about virtualization
Viewing all 111 articles
Browse latest View live

Zerto Virtual Replication 4.5 is available

$
0
0

Today Zerto announced the availability of Zerto Virtual Replication 4.5.

Zerto Virtual Replication (ZVR) is the flagship product of the company.

This hypervisor-based replication solution is currently the first and only one that delivers enterprise-class, virtual replication and BC/DR capabilities for the data center and the cloud.

Brief overview:

Responsible for the replication of the user-selected virtual machines is the Virtual Replication Appliance (VRA).

The VRA is a virtual machine that is automatically deployed on every physical host (Hyper-V and/or ESXi host).

Being installed directly  inside the virtual infrastructure enables the VRA to tap into the virtual machines I/O stream. Each write command of a virtual machine is captured, cloned and sent to the the recovery site. This means that in Zerto’s solution replication works at the VM level and not at the storage array level.

The advantage of this replication method is, that there is no need of snapshots at the hypervisor level and its fully storage hardware agnostic.

All VRA’s are managed by the Zerto Virtual Manager (ZVM) which connects directly to the vCenter Server (and/or SCVMM from Microsoft).

Zerto_Architecture

One big advantage of this solution is the incredible interoperability (cross-replication, multi-hypervisor support)! It supports for example replication from VMware vSphere to Microsoft Hyper-V (and vice-versa) or from Hyper-V/ESXi to Amazon Web Services (AWS) for Disaster Recovery.

If you want to learn more about ZVR then I suggest you to read the Hypervisor-Based Replication Deep Dive Whitepaper or you take a look into the sources mentioned below.

But what enhancements can you expect to find in Version 4.5?

  • new Installer
  • more VRA deployment capabilities (eg. VRA deployment automation with PowerShell,…)
  • Role Based Access Control (eg. Active Directory Integration,…)
  • Journal File Level Restore (allows recovery of individual files from a journal)
  • S3 Server Side Encryption in AWS
  • Compressed Journal
  • Feature Resiliency Improvements
  • new APIs/API Automation

Learn more about Zerto’s products:

Zerto Virtual Replication for Amazon Web Services (AWS)
Cloud-Based Disaster Recovery (DR)
Zerto Cloud Continuity Platform
DRaas: Disaster Recovery as a Service

ZertoCON 2016:

By the way, from May, 23 to May 25 Zerto’s first three day conference ZertoCON will take place in Boston, MA. Read more about this event here: ZertoCON 2016

ZertoCon 2016

Der Beitrag Zerto Virtual Replication 4.5 is available erschien zuerst auf All about virtualization.


How to change SATP claimrule and Path Selection Policy

$
0
0

For a new Hitachi storage (G600 in combination with Global Active Device and ALUA) we had to change the default SATP claimrule and the Path Selection Policy (PSP).

According to HDS the following settings are required:

  • Storage Array Type: VMW_SATP_ALUA
  • Path Selection:        VMW_PSP_RR

Unfortunately the default of the VMware ESXi 6 Update 2 Host is:

Storage Array Type: VMW_SATP_DEFAULT_AA
Path Selection:        Fixed (VMware)

To change the settings to the required one, we used the following commands:

  • run this command to add the PSA claim rule for the specific SATP:

esxcli storage nmp satp rule add -V HITACHI -M OPEN-V -s VMW_SATP_ALUA -P VMW_PSP_RR

  • and to set the default PSP for VMW_SATP_ALUA to VMW_PSP_RR:

esxcli storage nmp satp set -s “VMW_SATP_ALUA” -P “VMW_PSP_RR”

After a host reboot the new settings are automatically active:

Before:
PSP SATP before change
After:
PSP SATP after change

Der Beitrag How to change SATP claimrule and Path Selection Policy erschien zuerst auf All about virtualization.

vSphere 6 ESXi memory states and reclamation techniques

$
0
0

vSphere 6 uses the well known memory reclamation techniques you may already know from previous versions:

  • transparent page sharing (TPS)
  • memory ballooning
  • memory compression
  • memory swapping

The memory reclamation technique that is used depends on the ESXi host memory state, which is determined by the amount of free memory of the ESXi host at a given time.

With vSphere 6 VMware introduced a new memory state, called “clear state“.

So vSphere 6 knows five different memory states associated with one or more memory reclamation techniques to reclaim memory:

esxi-memory-reclamation-vsphere-6

But which treshold of free memory is associated with which memory state?

ESXi uses a value called “minFree” for the memory state calculation. minFree is a dynamic value and depends on the ESXi host memory configuration.

You can calculate minFree very easy for your ESXi host:
for the first 28 GB of physical RAM in the ESXi Host: minFree = 899 MB
+ add 1 percent of the remaining RAM to your calculation

minFree calculation vsphere 6

Figure: „minFree calculation example vSphere 6:

In the example above the ESXi host has 100 GB memory:
for the first 28 GB RAM minFree = 899 MB, for the remaining 72 GB (100 GB – 28 GB) we have to add 1% to minFree: 1% of 720 GB = 720 MB -> minFree is 899 MB + 720 MB = 1619

Thresholds:

  • high state: enough free memory available
  • clear state: <100% of minFree
  • soft state: <64% of minFree
  • hard state: <32% of minFree
  • low state: <16% of minFree

If you want to know the memory state of one of your ESXi hosts you can use ESXTOP (extract from the vSphere 6 ESXTOP quick Overview for Troubleshooting” diagram):

memory state esxtop vsphere 6

Open ESXTOP and type “m” for the memory tab. The host memory state is displayed in the first line on the right.

You want to learn more about ESXTOP?

Take a look at the vSphere 6 ESXTOP quick Overview for Troubleshooting” diagram:

ESXTOP vSphere 6

Der Beitrag vSphere 6 ESXi memory states and reclamation techniques erschien zuerst auf All about virtualization.

MicroSD card RAID 1 as VMware ESXi boot device

$
0
0

If you install ESXi on a microSD card and if you use HP Proliant Servers you may be interested in the “HP Dual 8GB MicroSD Enterprise Midline USB” (HP P/N: 741281-002).

This dual-microSD card module provides data redundancy through a mirrored RAID 1 configuration. You connect the module to the internal USB port and install ESXi as usual!

HP USB RAID 1 HP USB RAID 1HP USB RAID 1

If one of the SD card fails, the configuration of your ESXi host is still available and functional on the second SD card. In this case just replace the module with a new one, install the surviving SD card and configure it as primary.

The module has three status-LEDs:

USB RAID LEDs

  • LED 1 – Power LED

Green: device is on and at least one microSD card is functioning
Red:     both microSD cards have failed

  • LED 2 – SD Card 2

LED on: microSD card has failed
LED off: microSD card is healthy

  • LED 3 – SD Card 1

LED on: microSD card has failed
LED off: microSD card is healthy

How to install the module and VMware ESXi?


Installation and configuration of the module is really easy.

Plug in the microSD card module to the internal USB port and power on the server. The microSD card module is automatically configured and ready to use.

When you install VMware ESXi, you can select it as storage device during the install procedure. It shows up as “HP USB RAID LUN”:

HP USB Raid LUN

How to replace a failed microSD card?


If a microSD card fails you have to order a new module and carry out the following steps:

  • power down the server
  • remove the microSD card module
  • remove the working microSD card (status LEDs) = your new primary SD card
  • remove one of the SD cards in the new module and replace it with your primary one. Please remember the slot number!
  • install the module to the internal USB port
  • power on the server (you will see an error message 325: microSD cards have conflicting metadata. Configuration required)
  • press F9 to enter “System Configuration”
  • select “System Health” – “System BIOS”
  • highlight “Configuration required” and press Enter
  • in the “HP dual MicroSD” configuration menu select the “Primary SD Card Selection”
  • now select SD1 or SD2 as primary, depending on which slot contains the primary card from your old device
  • press F10 to save changes, exit the menu
  • reboot the server
  • the device will be reconfigured and your original boot option will appear
  • select the primary SD card
  • Done!

Der Beitrag MicroSD card RAID 1 as VMware ESXi boot device erschien zuerst auf All about virtualization.

vSphere Design consideration for branch office with 2 sites (part 2)

$
0
0

This is part 2 of the blog post:

Part 1: Requirements | Deployed Solution | Installation & Configuration
Part 2: Network configuration | LUN Design | VMware vSphere HA | Failure scenarios

Network configuration

(using six 1 Gbit adapters)

I configured three virtual standard switches:

  • vSwitch 0 (pNIC 0 and 1): hosting vMotion and Management Network (each one using a dedicated VLAN)
  • vSwitch 1 (pNIC 3 and 4): hosting the virtual machine network
  • vSwitch 2 (pNIC 2 and 5): hosting the iSCSI networks

When configuring the network, please note that it is necessary to enable FlowControl for the iSCSI ports.

A note about the division of the physical network cards:
The HP ProLiant ML350 Gen9 server has four on-board NICs. Additionally a 2 port network card was added. To avoid a single-point of failure one port of the onboard NICs and one port of the network card was used for vSwitch 1 and vSwitch 2.

LUN Design:

You should invest some time in your LUN design. In the example described in this blog post I configured only two LUNs:

  • LUN 1 is really large, hosting all the virtual machines
  • LUN 2 is really small (only 1 GB) to provide a second datastore for HA datastore heartbeat

VMware vSphere HA (High Availability):

VMware vSphere HA is part of the VMware ROBO license. In this use-case this important feature was configured as follows:

  • VMware vSphere HA is enabled
  • Datastore Heartbeat: HA requires a minimum of two datastores for Datastore Heartbeating. To fulfill this requirement a second, small datastore was configured
  • Host Isolation response: Power off

Consideration why using „Power off“ as Host Isolation Response:

Let’s better start with the reasons why I do not want to use the other response possibilities:

Shut down:
In a host isolation scenario, VMs running in the affected site will experience I/O failure as the VSA stops to operate. So a clean shutdown is not possible.

Leave powered on:
In a host isolation scenario, VMs running in the affected site will experience I/O failure as the VSA stops to operate. HA will restart the affected VMs on the host in the surviving site. After failed node comes back online, the same VM is running on both sites and you may experience a split brain scenario in the worst case.

Last but not least my consideration why I decided to use „Power off“:

VMs running in the affected site are powered off and HA will restart them in the surviving site. After the failed node comes back online, all affected volumes resync automatically.

Failure scenarios:

ScenarioImpact
ESXi host failure/complete site failureVirtual machines running at the failed site/at the failed host fail. VMware HA restarts the virtual machines on the host in the surviving site.
HP VSA virtual machine failureno impact - VMs still have access to the datastores provided by the VSA of the other site. After failed storage node comes back online, volumes resync automatically.
inter-site link failure between site A and Bno impact as long as every site can still access the quorum witness
Host isolated from other site and Quorum WitnessVMs running on the isolated host perform the action configured in the "Host Isolation Response". VSA of the affected site stops I/O to the datastores. No impact for the surviving site as long as it can access the Quorum Witness.
connection lost to Quorum Witnessno impact as long as inter-site link between site A and B is functional

Der Beitrag vSphere Design consideration for branch office with 2 sites (part 2) erschien zuerst auf All about virtualization.

vSphere Design consideration for branch office with 2 sites (part 1)

$
0
0

I want to introduce a vSphere design for a small branch office with 2 sites which I have implemented over the last month.

Due to the length of the blog post I decided to divide it into two parts:

Part 1: Requirements | Deployed Solution | Installation & Configuration
Part 2: Network configuration | LUN Design | VMware vSphere HA | Failure scenarios

Requirements:

Small branch office, about ten physical servers on-site.
The hardware is rather old and all servers should be virtualized using VMware vSphere. There is no shared storage available at the moment. Failover of VMs to other site should be possible.

Storage requirements: about 12 TB usable (a large fileserver is running on-site)
Network infrastructure: only 1 Gbit connections are available
Connectivity between sites: 2 x 10 Gbit
Budget: keep costs low

Deployed solution:

Hardware per site:

  • one HP ProLiant ML350 Gen9
  • CPU: 2 socket E5-2670 v3, each 12 cores @ 2,3 GHz
  • memory: 256 GB RAM
  • 16 x 10K SAS 1,2 TB drives (Raid 5 with one hot spare)
  • number of NICs: 6 x 1 Gbit

VMware license:

VMware vSphere 5 Remote Office Branch Office Standard (for maximum 25 VMs)

VMware vCenter Server:

The environment is managed with a central VMware vCenter Server running in the main datacenter (third location).

Storage:

Using a traditional storage system with mirroring (eg. IBM Storwize V3700) was not possible because of limited budget.

If high levels of availability and data protection are required for shared storage, you can use a virtual SAN product like eg. StarWinds Virtual SAN or HP StoreVirtual VSA Software.

In this use case I decided to implement HP’s StoreVirtual VSA Software version 12.5.

Since this version (12.5 and later) it is possible to use a Quorum Witness. Beside the Virtual Manager and the Failover Manager (FOM) the Quorum Witness is a new possibility to configure a tiebreaker for a two node cluster.

The advantage of the Quorum Witness over the already existing tiebreaker is, that it does not require access to the iSCSI network (routing iSCSI traffic to a third location might be a problem in most configurations and was not possible in the described use case, too).

The Quorum Witness only requires a NFS Version 3 fileshare situated in a third location, that must be accessible by the two VSA Managers. Other requirements are: write permissions to the share and a maximum latency of 300ms.

The following diagram gives you an overview of the network design:

There are two sites at a distance of 500 meter from each other (different buildings). The inter-link connection has a latency <2 ms as described in the “HP StoreVirtual Storage VSA Installation and Configuration Guide“. The diagram reflects also the Quorum Witness situated in the main datacenter of the company:

Site_networking_VSA

Diagram VSA storage solution:

vSphere designA Network RAID 10 stripes and mirrors the datablocks across the two storage nodes. Each storage node is using a Raid  5 with one hot spare disk to provide 15,6 TB storage.

Installation/Configuration:

The installation and configuration of the HP VSA solution is quite simple. If you want to deploy a HP VSA solution I recommend you to read the “HP StoreVirtual Storage VSA Installation and Configuration Guide” for a deeper insight.

Please note, that I will not describe every single step of the installation in this blog post – it is only a short overview to get a feeling about the necessary steps:

  • install vSphere ESXi on each host
  • configure storage array for each host (eg. with Raid 5)
  • configure ESXi according to the requirements of your infrastructure
  • ensure that you use the recommended versions of firmware and software (HP Recipes)
  • configure ESXi networking (see the example below)
  • configure your iSCSI storage adapters/network
  • deploy the HP VSA virtual appliance on each node
  • install the HP StoreVirtual Centralized Management Console
  • start the “Getting started” wizard to build your storage cluster

Before you start with the installation, I recommend you to invest some time in a good naming- and IP-address convention.


Click here for Part 2: Network configuration | LUN Design | VMware vSphere HA | Failure scenarios

Der Beitrag vSphere Design consideration for branch office with 2 sites (part 1) erschien zuerst auf All about virtualization.

How to remove Hitachi Dynamic Link Manager for VMware from Windows

$
0
0

If you want to remove the Hitachi Dynamic Link Manager (HDLM) for VMware from your Windows server you have to use the command line.

Open a command prompt and type: removehdlm

Available parameters for this command are:

-s      executes an unattended removal
-h      displays the format of the removehdlm utility

If you do not use any parameter, an uninstall wizard will appear:

uninstall Hitachi Dynamic Link Manager

If you take a look at C:\ (or the corresponding path where the Windows Operating System is installed) you can find a Logfile named “hdlmvmuninst.log”.

Take a look into this logfile to check if the removal completed successfully:
remove HDLM for windows

Der Beitrag How to remove Hitachi Dynamic Link Manager for VMware from Windows erschien zuerst auf All about virtualization.

How to enable the Managed Object Browser (MOB) for ESXi 6.0 Hosts

$
0
0

In the course of investigations for a support request I tried to connect to the Managed Object Browser (MOB) of an ESXi 6 Host as I am used to from ESXi 5.x Hosts.

I opened a browser to http://IP_of_ESXi_Host/mob and all I got was the following error:

503 Service Unavailable (Failed to connect to endpoint: [N7Vmacore4Http20NamedPipeServiceSpecE:0x2a71fd18] _serverNamespace = /mob _isRedirect = false _pipeName =/var/run/vmware/proxy-mob)

Error MOB ESXi 6

It took me some time to find out, that the access to the Managed Object Browser is disabled in vSphere 6 by default. Fortunately it is really simple to enable it again if necessary:

Just search for the following setting in the „Advanced Settings“ of your ESXi Host and activate the checkbox:

Config – HostAgent – plugins – solo – „Config.HostAgent.plugins.solo.enableMob“

enable MOB

Der Beitrag How to enable the Managed Object Browser (MOB) for ESXi 6.0 Hosts erschien zuerst auf All about virtualization.


How to execute QueryChangedDiskAreas using MOB

$
0
0

If you are not used to working with the vSphere Managed Object Browser (MOB) it can be a little bit tricky to execute the QueryChangedDiskAreas.

Here is a step-by-step guide:


MOB content

  • search for “root folder / ManagedObjectReference:Folder” and select “ha-folder-root”

MOB ha-folder-root

  • search for “childEntity” in the properties area and select “ha-datacenter”

MOB ha-datacenter

  • now select the datastore where the virtual machine resides. You should find a list of the datastores in the properties area, search for Name: datastore | type: ManagedObjectReference:Datastore

MOB datastore

  • in the last line of the properties area you can find the value: vm – select the appropriate VM:

MOB vm

  • now write down or copy the value “rootSnapshot | ManagedObjectReference:VirtualMachineSnapshot” – it should be something similar like “27-snapshot-68”:

MOB snapshot ID

  • scroll down in the same window to the Methods area and look out for “QueryChangedDiskAreas”  – click on the link:

MOB QueryChangedDiskAreas

  • a new window will open – it is named “DiskChangeInfo QueryChangedDiskAreas”

Type in the following values:

Parameter: snapshot -> replace MOID with the value copied before (eg. 27-snapshot-68)
Parameter: deviceKey -> to query the first vmdk file, enter: 2000
to query the second vmdk file, enter: 2001
Parameter: startOffset -> enter: 0
Parameter: changeID -> enter: *

MOB DiskchangeInfo

  • to start the query,  click on the link “Invoke Method”. You can print the output eg. using a pdf converter or copy it to a text-/wordfile.

Der Beitrag How to execute QueryChangedDiskAreas using MOB erschien zuerst auf All about virtualization.

How to – rollback/revert to a previous ESXi version

$
0
0

If you have to rollback/revert your ESXi host to a previous version, just perform the following steps:

  • connect to the console of your ESXi host (eg. using ILO,…)
  • reboot the ESXi host
  • when ESXi starts to load, press Shift + R (you will see a notice about this possibility on the bottom right oft he screen)
  • the following information will appear:

rollback esxi

  • press „Y“ to rollback ESXi to the previous version

The host will perform a reboot and then it starts with the previous build.

Der Beitrag How to – rollback/revert to a previous ESXi version erschien zuerst auf All about virtualization.

How to – reset CBT on multiple virtual machines using PowerCLI

$
0
0

There is a VMware KB article available that describes the necessary steps very well. But sometimes a picture is worth a thousand words – so here a detailed description with some screenshots. The advantage of this script is, that there is no need for a downtime of the affected virtual machines.

How to reset CBT for multiple VMs running on the same ESXi host:

Command: Set-ExecutionPolicy Bypass

reset_cbt_0

  • start the downloaded script:

Command: .\CBT-Reset.ps1

you can now cancel the script pressing “control” + “c” or you specify the FQDN (or IP address) of the host whose VMs you want to reset CBT.

cbt reset powercli

  • a window opens where you can specify the root credentials to the ESXi host:

specify credentials

The script will now list all VMs where CBT can be reset and those, where a CBT reset is not possible. There are two reasons why a CBT reset is not possible: the VM is powered off or an open snapshot exists.

You can now cancel the script pressing “control” + “c” or you press any key to start the CBT reset of the applicable VMs. Depending on the number of VMs the script will run some minutes – do not cancel it once it is executed.

cbt_reset_list_vm

Please note, that the first backup after resetting CBT will be a Full Backup. This backup will take a longer time to finish and of course it is necessary to backup more data than performing an incremental backup!

Der Beitrag How to – reset CBT on multiple virtual machines using PowerCLI erschien zuerst auf All about virtualization.

CloudPhysics deep-dive into the data lake

$
0
0

Have you ever wondered how your VMware data center performs in comparison with others? Have you ever wished to have a reliable data set at disposal to justify investments in your IT infrastructure?

I am sure you have. But unfortunately, the required data is only in rare cases quick and well-prepared available.

Data Lake CloudphysicsCloudPhysics vision of Big Data for IT operations may be the answer to questions similar to those above.

During Tech Field Day 11 in Boston, they demonstrated the potential of their solution based on some use cases.

I do not want to repeat them all within this blog post as you can watch the records of Tech Field Day whenever you want on Vimeo (you can find the links to the videos below).

But I want to summarize in this blog post, why I was so impressed by the possibilities this incredible volume of data can offer and enable for everyone.

So let’s start with some basics. First, where is all the data coming from?

The data is collected by a small VM that is deployed by CloudPhysics customers in their virtual environments. And the number of devices delivering metadata for the data pool is already amazing:

  • 700.000 connected VMs
  • 100.000 connected datastores worldwide
  • 37.000 connected Servers
  • 12.000 Global Users

The collected metadata is transferred to CloudPhysics data center where it is automatically correlated and analyzed. The results are provided to the customers for troubleshooting, monitoring and optimizing their environments.

And now the magic begins:

CloudPhysics enables you to create and query your own reports beside a large set of predefined ones.  If you want, you can publish your self-created queries to a public dashboard . So other customers can use your reports and of course they can rate and edit them, too.

Imagine the endless possibilities! One example was mentioned in CloudPhysics #TFD11 presentation: identifying the danger of newly discovered bugs for your environment.  Or you can compare different software versions against each other in relation to latency, CPU time or whatever comes to your mind. The virtualization community is a really powerful one. So chances are good that the number of high-quality queries provided by other users will increase over time. And most customers have the same or similar requirements and needs.

Another interesting approach is the recently announced Partner Edition. This solution enables channel and vendor partners to increase technical support for their customers and introduces new opportunities using CloudPhysics data lake.

To achieve this goal as best as possible, the partners can fall back on pre-defined queries and assessments. Or they design them by their own to provide answers to certain basic questions like public cloud migration assessments, Health checks, competitive analysis and much more.

Currently, CloudPhysics only supports VMware environments. I understand, that particularly in the early stage of a new solution it is necessary to focus on a product with a high market share to quickly achieve results. But in my opinion, the time has come to extend the support to more hypervisors (eg. KVM, Hyper-V,..) to increase  the data set respectively the data depth.

That would allow other really interesting statistic analyses eg. the comparison of different vendors. I am not sure if everybody would welcome such possibilities, but it would be great from a customer perspective.

Curious?

Here you can find the presentation of CloudPhysics for Tech Field Day 11 in Boston (June 23, 2016):

Presenters:

  • John Blumenthal
  • Chris Schin

CloudPhysics Introduction with John Blumenthal


Watch on Vimeo

CloudPhysics Editions and Use Cases


Watch on Vimeo

CloudPhysics Developer Edition and Card Builder


Watch on Vimeo

CloudPhysics Analytics Discussion


Watch on Vimeo

CloudPhysics Global Data Set


Watch on Vimeo

Der Beitrag CloudPhysics deep-dive into the data lake erschien zuerst auf All about virtualization.

Runecast – providing a magic insight into your datacenter

$
0
0

I don’t know about you, but in my view, serious software issues and bugs have increased in the last years. If you are responsible for a VMware environment you have to take care of all of them – or better you should. Data Center Outage Runecast

Because with an increasing number of products and the resulting dependencies, this task is becoming more and more difficult and, in larger environments, nearly impossible.

At VMworld 2015 in Barcelona, I noticed a company in the New Innovator Area of Solutions Exchange that addresses that challenge. It was the Co-Founder and CEO of Runecast itself, Stanimir Markov (@sferk), who gave me a deeper insight into the solution.

The company was pretty new on the market at that time and completely new for me. Stanimir was so kind and explained me Runecast’s solution. And the more he talked about it, the more I liked the idea behind it.

So what are they doing?

I guess every one of us is using the VMware Knowledge Base – or has heard about it at least 🙂 The Knowledge Base is an inexhaustible source of documented issues, practical experiences, and best practices about VMware’s range of products. Runecast’s idea is, to automatically analyze this data and match it against the configuration and logs of your data center. Pretty cool, isn’t it?

As I had Runecast on my radar frequently since this conversation at VMworld 2015, I think it is now time to introduce you this innovative solution on my blog.

So, what can Runecast do for you and how does it work?

In a first step, you have to deploy a small virtual appliance and need credentials to access the vCenter server. It is not necessary to tell you more about this appliance because deployment and configuration are straightforward and self-explaining.

Immediately after deployment, the software starts to gather all logs and configurations of your VMware environment. Let me specially mention that no data is leaving your data center. All analysis are happening on site – an important consideration for many companies, even in times of “cloud is so sexy…”.

And now the magic begins… Runecast addresses three important needs of IT departments (or better VMware admins) these days.

Runecast VMware Knowledge BaseFirst, it matches the gathered data of your environment against VMware Knowledge Base articles.

You will be surprised how many issues are lurking, even in a well-maintained environment.

As new issues, bugs and other nice surprises are coming up every day, this function is really a great help for every admin. Of course, Runecast also assists you with specific recommendations/resolutions how to deal with these issues – and this in a proactive and dynamic way.

The second advantage is the analysis of your environment against the VMware Best Practice Guide.

Runecast can help you to report and document the potential for improvement. Of course, there may be reasons for an admin to deviate from best practices. But in most cases, it makes sense to take care of them. And at the end of the day it is up to you if you want to implement them or not. But if it does not apply to your environment, simply exclude it from the report. Then it is documented and this helps you to survive the next definitely coming security audit.

From my own personal experience, the third advantage of Runecast is my favorite. I am sure you are familiar with the following situation. You spend hours of your valuable time to work through the VMware Hardening Guide. This is really a hard and long-lasting activity as you have to evaluate every single recommendation, and take care if it applies to your infrastructure or not.

Then you have to check all your hosts and virtual machines if they meet these requirements. At best you write some scripts helping you to find misconfigurations – or in the worst case, it is a manual process.

Once this task is done, you can be sure that a colleague will change a configuration without your knowledge in the near future…

With Runecast the environment is checked against the VMware Hardening Guide continuously. That not only improves the security of your infrastructure, it also helps you to pass security audits more easily.

Interested? If you want to learn more about Runecast I recommend you to take a look at their website. They offer a Live Demo of the Runecast Analyzer where you can play around a little bit with the solution. I really appreciated this possibility and can only recommend you to give it a try.

Der Beitrag Runecast – providing a magic insight into your datacenter erschien zuerst auf All about virtualization.

Improve your documentations with Visio Stencils for VMware, Hyper-V and Veeam

$
0
0

Working in IT, one important part of the daily work is documentation. And we all know, how much work it is to create meaningful visualizations of your data center designs. One part that can be very time intensive is searching for the appropriate infrastructure icons.

veeam_stencils1Here Veeam can support you with the free Veeam Stencils for VMware, Hyper-V and Veeam. Its a collection with all the icons you are looking for when creating diagrams about your IT-infrastructure.

In the collection you can find for example icons for:

    • VMware ESXi and Microsoft Hyper-V
    • Veeam components
    • Datacenters
    • SCVMM
    • Local, shared and off site storages
    • LUN
    • VMs with status sign
    • NIC’s
    • Networks

I am a big fan of these stencils as they make my daily work a little bit easier – and as I wrote before – they are free!!

By the way, if you are not working with Microsoft Visio you can although use them. Just copy them with the snipping tool and paste them for example into your word documents.

You can find the stencils at Veeam’s Website: VEEAM.com

Der Beitrag Improve your documentations with Visio Stencils for VMware, Hyper-V and Veeam erschien zuerst auf All about virtualization.

Paessler PRTG – Network Monitoring Made in Germany

$
0
0

It is not a secret, that a functional network keeps the company productive and your boss happy. In further consequence, your life as the responsible administrator is without stress and more comfortable.

To reach this goal, the implementation of a network monitoring tool is a reasonable measure 🙂

When reviewing the market of network monitoring solutions,  you will discover sooner or later Paessler’s PRTG Network Monitor.

paessler-prtg

Paessler AG was founded 1997 in Nuremberg, Germany and is a privately held company. In the beginning, PRTG was a solution closing the gap of having a tool to monitor the network and server load.In the meantime, PRTG is providing the “all around wellness package for monitoring” and the

In the meantime, PRTG is providing the “all around wellness package for monitoring” and the list of available sensors for PRTG is long and growing permanently.

Beside the initial capabilities of network and server load monitoring, the solution now enables you to monitor your virtual infrastructure (VMware, Hyper-V) as well as mail server, databases, hardware, and much more.

With the power of the vCommunity, there are also possibilities to connect solutions with PRTG that are not available “out of the box”. A quick search on google and you will find great posts like this: Monitoring Veeam Backup and Replication using PRTG.

But how does PRTG get the information from the monitored devices?

The good answer is: PRTG does not require agents, nor any other additional software installed on the monitored systems. It is using the native management interfaces including SNMP, SSH, WMI and others.

prtg-screenshot

When it comes to licensing, you should know that PRTG is not licensed on a per device basis. Paessler is using license options based on the number of sensors. Per their own definition, a sensor is one aspect that you monitor on a device.

It therefore follows, that you normally have to license more than one sensor for one monitored device. Paessler is calculating with between five and ten sensors. (What counts as a sensor?)

The best way to learn about a product is hands-on. After downloading and installing the software you have 30 days without any restrictions to test it for free. And there is also a Freeware Edition available that allows up to 100 sensors (PRTG Network Monitor Licenses and Prices) – enough to monitor your home lab or smaller environments for example.

paessler-prtg-apple-watchNice to have: for technically affine users (or better the computer nerds…) they offer an Apple Watch extension of PRTG for iOS. Busy admins can use it to receive push notifications directly to their Apple Watch where ever they are…

What are my personal findings of PRTG Network Monitor?

First, I am not a networking guy. So I can definitely not say if there is something missing or badly implemented from this perspective.

What I need is a tool that is simple to manage, easy to scale out and serving as my eyes and ears in the infrastructure I am responsible for. And, of course, once implemented it should not be time intensive during operation.

I installed PRTG in my home lab and spent some time to configure it in accordance with my wishes. This was working very well for me in a reasonable time and I was able to see all the information I was looking for in this test environment.

So, as a conclusion – if you are evaluating a new monitoring solution it makes sense to take Paessler’s PRTG Network Monitor into account. For a first impression, you can take a look at the PRTG Online Demo available here: PRTG Online DEMO

By the way, Paessler AG was presenting at Tech Field Day Extra Europe 2016. The presentations are available online and they are a great resource to learn about their solution in a form:

Der Beitrag Paessler PRTG – Network Monitoring Made in Germany erschien zuerst auf All about virtualization.


HPE ProLiant ML350 Gen9 BIOS P92 v2.30 introduces 2+2 Redundancy Power Supply Mode

$
0
0

The latest Service Pack for ProLiant (SPP) Version 2016.10.0 introduced an important BIOS Upgrade for ML350 Gen9 Server when using four power supplies.

With the older BIOS Version, the Redundant Power Supply Mode was configured per default for 3+1 Redundancy.

This means, that if you lose one out of four power supplies everything is still fine.
But a problem arises if you lose a second power supply. Because then the server shuts down immediately as the redundancy rule is violated.

A big problem, because server racks very often only have two separate power circuits. Losing the wrong power circuit will shut down your server if you run the 3+1 redundancy. Same problem with your UPS…

New with P92 v2.30: the 2+2 redundancy mode


But fortunately the new BIOS for ML350 Server (BIOS P92 version 2.30) allows you to choose between a 3+1 redundancy and a 2+2 redundancy mode:

  • Install the latest Service Pack SPP 2016.10.0

updates_spp

  • Press F9 during boot up in order to access your server BIOS
  • select “Advanced Options”

bios-advanced-options

  • select “Redundant Power Supply Mode” and choose between “Configured for 2+2 Redundancy” and “Configured for 3+1 Redundancy”

redundant-power-supply-mode

Der Beitrag HPE ProLiant ML350 Gen9 BIOS P92 v2.30 introduces 2+2 Redundancy Power Supply Mode erschien zuerst auf All about virtualization.

How to upgrade HPE Storevirtual VSA to version 12.6

$
0
0

This blog post is a step-by-step guide how to upgrade an existing HP StoreVirtual Infrastructure to LeftHand OS 12.6.

What’s new with version 12.6?

One enhancement of the latest version is, that you can now restart the upgrade without assistance from HPE Support if an upgrade fails (read more about this at the end of the blog post)

Beside some fixes and code improvements the following enhancements are worth to mention, too:

  • a new Network Diagnostic utility, which provides ping, traceroute and IPERF functions
  • createSnapshotSet and rollBackVolume action object modes were added to the REST API
  • the jumbo frame option as been re-enabled for StoreVirtual VSA’s
  • improvements, if a volume gets into the unrecoverable IO state (support has more/better possibilities now to help)
  • in case, that the retransmit rate exceeds 0,5% an event is now generated automatically
  • the minimum recurrence for snapshot schedules has been reduced from 30 minutes to 15 minutes


Before you begin:

Read the release notes carefully and check the following topics:

  • verify, that your StoreVirtual Version is supported for a direct upgrade (direct upgrades are supported from version 11.5, 12.0 and 12.5)
  • check the health of your VSA Infrastructure (are all managers running, is the quorum witness available,…?)
  • is your documentation up-to-date?
  • HPE recommends upgrading firmware before upgrading to v12.6 -> did you?
  • check all other dependancies as stated in the Release Notes (SRM, Hardware compatibility,…)


If you haven’t done it until now, you can configure your upgrade preferences here:

In the HPE StoreVirtual Centralized Management Console (CMC): Help – Preferences – Upgrades

VSA Upgrade 12.6

Then switch to the “Upgrades” tab where you get an overview about available upgrades for your infrastructure:

VSA Upgrade 12.6

1. Upgrade the Centralized Management Console (CMC)

The first step is the upgrade of the local installation of your CMC.

Click “Start Download” and wait until the download is completed. Then click “Continue…” to start the upgrade. At this time only the local installation of your CMC will be upgraded. The storage itself will not be touched in this step.

When the upgrade of the CMC is done you can perform the next step:

2. Upgrade of all Storage Systems in a Management Group


The next step is the invasive and exciting part of the upgrade. Once the upgrade has been started, it should not be terminated. It will upgrade the following components in one go:

  • all Storage Systems in the concerned Management Group
  • HPE StoreVirtual VSS Provider
  • HPE StoreVirtual DSM for MPIO
  • HPE StoreVirtual Command-Line Interface (CLI)

As in step 1, start the download of the binaries (click “start download”)

VSA Upgrade 12.6

Before you proceed with the upgrade, please verify again if the environment is healthy (all systems up and running, Quorum Witness available,…). When you are ready to upgrade, select “Continue…”

Read the warning message carefully. Select “OK” to start the upgrade or “Cancel” if you want to stop:

VSA Upgrade 12.6

Once the upgrade is started you can only lean back and wait.

Do not get nervous if nothing happens for some time – the installation will go on!

The upgrade process will take care of availability and performs the installation of the storage systems one after the other. Every successfully upgraded device will be marked with a green hook.

At the end you should see “100% Complete” and a green hook for every device:

VSA Upgrade 12.6

When all upgrades are done check the health of your VSA Infrastructure.


HPE VSA Upgrade failed, help!


For the unlikely event of a problem during the upgrade process, you have the possibility to abort the unfinished installations. Before you do this you should find out the reason and check the health of your environment. If you are not sure how to proceed, better open a support request at HPE.

In my case an upgrade failed as one of the patches could not be installed at the first try  for inexplicable reasons. I checked the storage systems twice and noticed that everything was up and running. There were no errors in the logs except the one with a failed patch installation. So I decided to abort the upgrade (87 percent were done at this time):

VSA Upgrade 12.6

As everything looked fine, I started the upgrade again. The missing patch was installed correctly anwizardizzard completed successfully.

Der Beitrag How to upgrade HPE Storevirtual VSA to version 12.6 erschien zuerst auf All about virtualization.

Fun with Tags

$
0
0

Fun with TagsOk, working with vSphere Tags is basically not funny, but it can be extremely helpful.

And to be honest, there is another explanation why I decided to use this title for the blog post.  If you know Big Bang Theory you definitely know why 🙂

But let us focus on the topic “VMware vSphere Tags”…

The possibility to apply tags to objects in the vSphere inventory was already introduced with vSphere 5.1. Tags are an enhancement of the legacy “Custom Attributes” and are a charming feature you should definitely use.

It enables you to add valuable information to the inventory objects and make them searchable and sortable. So you can add a tag with the responsible person or department to a virtual machine. Or if you classify your virtual machines to meet Service Level Agreements (SLAs), you can provide the necessary information in a tag. Furthermore, they are extremely helpful and powerful if you use them in scripts.

So let’s start with some basics:

Tags and Categories VMwareWhat is a Tag?

A tag is a label that you can apply to vSphere inventory objects like virtual machines, hosts, datastores,… Every tag is assigned to a category.

What is a Category?

A category contains one or more tags and groups them together. A category also specifies if you can assign multiple tags out of the category to an object or only one.

For better understanding here an every-day-work example:

You want to classify your virtual machines into three different availability tiers: Production, DEV, and Test

Create a new category called “Availability” and choose “one tag per object” (because if a virtual machine is classified as “Production” it cannot be “Test” or “DEV”). In the wizard, you can also specify if the new category is associable only with dedicated object types or all:

By the way, if you try to create categories or tags within the “old” vSphere Client, then I have to disappoint you. Tags and Categories are only available using the Web client 🙂

In the next step, you will create three different tags called Production, DEV, and Test and assign them to the previously created category “Availability”:

New Tag VMware Web Client

Now everything is prepared to classify your virtual machines into the new created Tiers. Select a VM in the Web client and search for the field “Tags”. Select “Assign” and add the accurate tag:

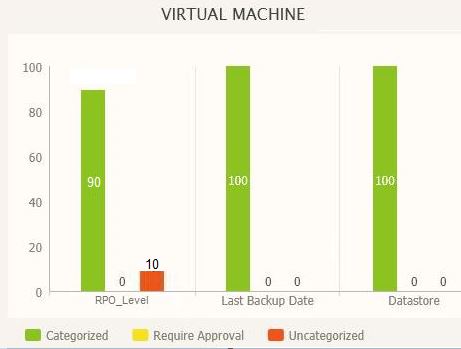
If you play around with Tags and Categories within the Web client, you will find out quickly how useful this feature is. So you can use the Filter to display eg. only VMs classified as “Production”:

Managing Tags and Categories with PowerCLI

One of the best things about tags and categories is, that you can manage them with PowerCLI!

Get-TAG

So let’s start with the Get-Tag to list all defined tags:

Get-Tag

Get-VM -Tag

To list all VMs with the Tag “Test” you can use the command:

Get-VM -Tag “Test”

get-VM -tag

It is easy to manage tags with PowerCLI, isn’t it? But there are more commandlets available. Give these ones a try:

Get-TagAssignment

This command lists all assigned tags for different entities.

If you want to list eg. all tags assigned to a dedicated ESXi host just trigger:

Get-TagAssignment -Entity “your_ESXi_Host”

New-TagAssignment

With this command, you can assign a tag to an object.

For example to assign the tag “DEV” to the VM “DEV_VM1” use:

New-TagAssignment -Tag “DEV” -Entity “DEV_VM1”

Remove-TagAssignment

Very surprising this command enables you to remove an assigned tag from an object. If you want to remove the tag from the VM configured above just try the following:

Get-VM “DEV-VM1” |Get-TagAssignment |Remove-TagAssignment

If there are more tags assigned to the VM you will be asked for every single tag if you want to remove it or not.

Appetite for more?

If you like to work with the commands presented above, take a look at all the other available ones. The following command will list them all for you:

get-command -PSSnapin vmware.vimautomation.core *tag*

How to assign different tags to many virtual machines (using a .csv file)?

When you start to work with categories and tags you will fairly soon need a possibility to assign a tag to a list of virtual machines.

To give you an idea how it works, I will stick to the example from the beginning of this blog post.

The challenge: assign different tags (Test, DEV, Production) out of one category (Availability) to a list of VMs.

  • The list:
    VM      Tier
    —————–
    MyVM01             DEV
    MyVM02             DEV
    MyVM03             Test
    MyVM04             Production
  • Step 1: create a .csv file (eg. vm.csv) with the following content:

VM,Info
MyVM01,DEV
MyVM02,DEV
MyVM03,Test
MyVM04,Production

  • Step 2: create the category and tags (if you have not already done it for the example above)
  • Step 3: use the following script to assign the tags to your VMs:

$csv = Import-CSV C:\vm.csv
$csv| foreach {
$vm = $_.vm
$tag = $_.info
New-TagAssignment -Tag $tag -Entity $vm
}


  • If you are not used to the PowerCLI here some hints that may help you:

save the script above as a .ps1 file
open PowerCLI
connect VI-Server “your_vCenter”
navigate to the path with the .ps1 file
execute the script with the command:  .\filename.ps1


Ready for Episode 2 of “Fun with Tags”? Here we go: Tags and Veeam


Fun with Tags, Episode 1: Basics and PowerCLI
Fun with Tags, Episode 2: Tags and Veeam

Der Beitrag Fun with Tags erschien zuerst auf All about virtualization.

Fun with Tags, Episode 2: Tags and Veeam

$
0
0

Fun with Tags and VeeamFun with Tags, Episode 1: Basics and PowerCLI
Fun with Tags, Episode 2: Tags and Veeam

In the first episode of “Fun with tags” I wrote about some vSphere tag basics and the charming PowerCLI integration.

In this episode, I will introduce you some possibilities of vSphere Tags in combination with Veeam Backup and Replication, respectively Veeam ONE.

Part 1: Tags + Veeam Backup and Replication


If you are used to Veeam Backup and Replication you may know, that you can add objects to a backup job based on different criteria’s:

  • if you need a job for one or more dedicated VMs you can add them individually. This is a static collection and you have to add or remove VMs manually.
  • if you are looking for a job that is adjusting dynamically to any change, you can add an entire cluster or even an entire vCenter Server to a backup job (Host and Clusters).
  • or you prefer to select the objects based on folders (VMs and Templates) or datastores (Datastores and VMs).

So one may ask, why the heck should I use tags when there are so many other possibilities to select objects for a backup job?

The answer is, that using tags provides significantly greater flexibility besides other advantages. Here are some reasons why I believe in tags:

A virtual machine can only reside in one folder. So if you already use the folder structure to classify your VMs for a given task (eg. permissions) it is not possible to add the VM to a second folder for another task.

When using tags, you can assign multiple tags to the same object. Furthermore, folders are usually maintained by administrators. In contrast, tags can also be applied by users (if they are allowed to do so).

The same reasons apply in similar ways for datastores and clusters. They are maintained by administrators and above all not intended for use as selection criteria. It’s nice if it works for you, but sooner or later you will hit some limits 🙂

Other advantages of using tags eg. in filters and searches or in combination with scripts I already described in “Fun with Tags, Episode 1: Basics and PowerCLI“.

But let’s come back to the backup jobs with an…

Every-day-work example for Veeam backup jobs + tags


Imagine your boss wants you to classify the virtual machines based on different RPO times. Building on this information, the backup jobs should run as often as necessary to fulfill these requirements.

Using tags, you can manage this task really easy and you make your boss happy:

  • create a vSphere category “RPO Level” and as many tags as necessary. Here an example with three backup policies:

RPO_Standard  -> run backup every 24 hours
RPO_High         -> run backup every hour
RPO_NoBackup -> no Backup necessary (eg. Test)

As soon as the category and the tags are available and assigned to your VMs, you can create the corresponding backup jobs:

  • open Veeam Backup and Replication
  • select Backup & Replication -> Jobs
  • start the “Backup Job” Wizard
  • select “Add…” and change to “VM and Tags” view
  • select eg. the Tag “RPO_High” (Backup every hour)

Veeam New Backup Job

  • when the wizard asks you to define the schedule, select “Run the job every 1 hour”:

Define one job per desired RPO time related to the created tags. If a new VM is deployed, it will be added to the respective backup job dynamically, as soon as it is tagged. No need to take care of backup jobs and associated VMs anymore!

Stop! What if one forgets to tag the VM? No protection?

Indeed, if somebody deploys a new VM and forgets to assign the necessary tag it will not be included in a backup job.
For that reason, we created the backup policy “RPO_NoBackup” in the example above.

The tag “RPO_NoBackup” is not associated with any backup job and should be assigned to every VM, where no backup is needed/wanted (eg. for Test-VMs). Doing so enables us to identify untagged VMs very easy with the help of Veeam ONE.

You will learn more about this in the next part.

Part 2: Veeam ONE + tags


Before you can use vCenter Server tags within Veeam ONE you have to perform an initial object categorization in Veeam ONE Business View.

To map your defined categories to Veeam ONE Business View categories, follow these steps:

  • Review/edit your Veeam ONE Categories
  • log-in to Veeam ONE Business View
  • open the Configuration Tab
  • select “Categories” from the left side of the window
  • Add/Remove/Edit the categories if necessary

Map tags from VI Management Server

  • select “Import/Export” from the left side of the window
  • select “Map tags from VI Management Server -> Run Wizard”

  • define Tag to Category mapping
  • review the detected tags
  • Finish

If you now take a look at “Groups” (left side of the window) you can see the imported tags in the corresponding group:

And of course they are also available in the Business View containing all objects assigned with the respective tag:

Important note:
This example is kept very simple for easier understanding. If you want to use Veeam ONE Business View Categories, Groups and Tags in production I recommend you to take care of the Veeam Help Center | Business View User Guide.

Using Veeam ONE to identify VMs with no RPO Tag


As I wrote in part one of this article, it is necessary to take care of untagged virtual machines if you use them for backup jobs. As the vSphere tags are now mapped with Veeam ONE, you can filter/search for uncategorized VMs very easy.

If you play around with the Veeam ONE Business View dashboard you will find the following graph:


If you take a look at the RPO_Level graph: Ten percent of the VMs are not categorized.

That means they are not protected in our use case!

To identify the uncategorized VMs, change to the Tab “VM” and select “Uncategorized” as requested status. This will display all uncategorized VMs. If necessary, you can export them to Excel, too:

Assign the corresponding tag to the uncategorized VMs – and your backups will work like a charm!

I hope I was able to give you an idea, how powerful vSphere tags can be in combination with third party vendor software like eg. Veeam!

Read more in the other episodes of “Fun with Tags”:

Fun with Tags, Episode 1: Basics and PowerCLI
Fun with Tags, Episode 2: Tags and Veeam

Der Beitrag Fun with Tags, Episode 2: Tags and Veeam erschien zuerst auf All about virtualization.

HPE DL380 Gen9 “Starting drivers Please wait” after deploying BIOS P89 v2.40 (SPP 2017/04)

$
0
0

After deploying BIOS P89 v2.40 (02/17/2017) and/or ILO Firmware 2.50 (09/23/2016) an HP DL380 Gen9 Server stops during early BIOS boot sequence at the following message:

“Starting drivers. Please wait, this may take a few moments…”

HPE DL380 Gen9 starting drivers
Note: BIOS P89 v.2.40 is part of the HPE SPP from April 2017 (SPP 04/2017)

It seems, that there is a problem when you install BIOS B89 v2.40 in combination with the ILO Firmware v2.50. A possible workaround is to downgrade the ILO Firmware to Version 2.40.

Workaround:

  • download ILO Firmware v2.40 (1 Apr 2016) -> cp027575.exe
  • extract the content of cp027575.exe to C:\temp
  • connect to the ILO of the affected host
  • go to “Administration” – “Firmware”

FW ILO Upgrade HPE Server

  • select the file “ilo4_240.bin” from C:\temp

ILO4 2.40 BIN

  • click “Upload” to start the downgrade
  • Done!

When done, please check that you use the following combination: BIOS P89 v2.40 (02/17/2017) with ILO Firmware v2.40 (04/01/2016)

Der Beitrag HPE DL380 Gen9 “Starting drivers Please wait” after deploying BIOS P89 v2.40 (SPP 2017/04) erschien zuerst auf All about virtualization.

Viewing all 111 articles
Browse latest View live


<script src="https://jsc.adskeeper.com/r/s/rssing.com.1596347.js" async> </script>